Wednesday, July 21, 2010
Cadalyst Article on How to Work with Point Clouds
Wednesday, February 17, 2010
Cadalyst Article on CAD Queries with AutoCAD Map 3D
Please be sure to check out both the article and the video.

Wednesday, February 3, 2010
How to Unlock the Data in your CAD Drawings
Are you using AutoCAD to help plan and manage your infrastructure network? Are you wondering how you can access and better use the information in your AutoCAD drawings? Do you want to be able to analyze your AutoCAD drawings, generate material lists and reports, or reveal new patterns in the data? If so, there is a way with AutoCAD Map 3D – the better AutoCAD for working with your infrastructure data.
With AutoCAD Map 3D you can query your AutoCAD drawings in much the same way that a spreadsheet or database can be queried. For example, with AutoCAD Map 3D, you can query by CAD properties such as color and layer, as well as, by location.
Consider a scenario in which a water utility or municipality is reviewing their watermain replacement program. Cast iron watermains are considered a priority. The AutoCAD drawing containing information about the watermain network must be analyzed to determine the location of the cast iron watermains, as well as, their corresponding lengths and diameters.
To see how this type of analysis can be done, please review the following short video which demonstrates the use of CAD queries in AutoCAD Map 3D.
Thursday, November 19, 2009
Cadalyst Article on Geospatial Queries with AutoCAD Map 3D
Monday, August 24, 2009
Cadalyst Article on Geospatial Analysis with AutoCAD Map 3D
Thursday, August 13, 2009
Learn Geospatial Analysis at AU2009
Autodesk University 2009 (AU2009) will be held December 1-3, 2009 at the Mandalay Bay Resort, Las Vegas. AU2009 is one of my favorite learning events of the year and the perfect opportunity to connect with professionals from all over the world and explore new ideas, technologies and workflows. Early registration for AU2009 commenced on August 12.
I’m thrilled to be participating at this event and happy to once again have the pleasure of facilitating a class on geospatial analysis. If you are an engineering, CAD or GIS professional; if you are an existing AutoCAD Map 3D user; or simply interested in learning how to analyze your CAD drawings and geospatial data; check out my 90-minute class entitled, “Analyze This! How to use AutoCAD Map 3D for Geospatial Analysis”. The topics that will be covered include:
- Enhanced overlay capabilities and the new workflow framework
- Databases, tabular joins and the expression builder
- Thematic mapping techniques
- Geospatial buffers and point, line and polygon topologies
- 3D surfaces
If you’re going to be attending AU2009, be sure to register for Class ID: GS314-2 and please say “Hi”. I look forward to meeting you!
Wednesday, August 5, 2009
How to Keep both Water and Data Flowing with AutoCAD Map 3D
 My colleagues Peter Southwood, Neal Niemiec and I recently had the pleasure of participating in a series of webcasts, hosted by DLT Solutions, Inc., on the topic of using AutoCAD Map 3D to improve data access, data confidence and utility of water and wastewater data. Descriptions and links to the archived webcasts appear below.
Analyzing your Water/Wastewater Data with AutoCAD Map 3D
Presenter: Michael Schlosser, Autodesk
AutoCAD Map 3D is a leading engineering platform for creating and managing your water/wastewater design information. However, AutoCAD Map 3D also has powerful querying and analysis capabilities that help you to examine your water/wastewater networks in new and useful ways. This presentation shows how queries, thematic mapping, buffers, and overlay analysis can be used to better leverage your water/wastewater data.
Recorded on July 29, 2009
Length: 50 min
Link to Webcast: http://www.dlt.com/Analyze-Water-Archive
Improving Data Confidence with AutoCAD Map 3D for Water/Wastewater
Presenter: Neal Niemiec, Autodesk
Managing water and wastewater systems within budget and to agreed upon service levels requires reliable information about the network throughout the infrastructure lifecycle. However, this requirement is threatened by a lack of data standards which can negatively impact budgets, operations, and maintenance activities. AutoCAD Map 3D improves data confidence with industry specific attribute fields, symbology and classification templates. This presentation focuses on the water/wastewater utility toolkits for creating and maintaining data according to specified standards.
Recorded on July 14, 2009
Length: 41 min
Link to webcast: www.dlt.com/autodesk/DataConfidence-Archive
Improving Access to your Water/Wastewater Data with AutoCAD Map 3D
Presenter: Peter Southwood, Autodesk
Access to current and accurate data about your water/wastewater network is crucial for sound decision making. AutoCAD Map 3D aggregates critical CAD, GIS and utility data for field, management and regulatory purposes. This presentation focus on how to improve data access and addresses connecting to data using Feature Data Objects (FDO), attaching to DWG files, importing/exporting foreign CAD/GIS data sources and creating PDF/DWF files.
Recorded on June 22, 2009
Length: 58 min
Link to webcast: www.dlt.com/Improve-Access-Archive
Sunday, August 2, 2009
How to use Negative Distances in your Geospatial Buffer Analysis
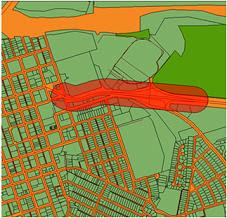
However, did you know that you can also use a negative distance to create a buffer? That’s right! When you use a negative distance, such as -25m, to buffer a polygon feature, the result is a smaller polygon – a polygon that is inside the source feature.

HabitatZone = BufferOutside25 – BufferInside100
The total area of habitat available is equal to the area of the zone of available habitat (ie HabitatZone).
Check out the video to see the process in action with AutoCAD Map 3D.
Monday, July 20, 2009
Engineering GIS in LEED for Neighborhood Development
From a civil engineering perspective, LEED for Neighborhood Development (LEED ND) is an opportunity to bring together engineering design and GIS analysis methods in order to meet a set of documented requirements for achieving LEED certification. For example, the Smart Location and Linkage category encourages brownfield developments to reduce urban sprawl. Maximum credit can be attained if the project is located in a previously developed infill site that is also in a high-density area. In this case, high-density is a function of the number of street intersections within a half-mile of the project boundary.
 To determine how well a project complies with these criteria, we can apply an Engineering GIS approach that leverages both CAD and GIS data. First, rather than using an import/export method to bring together the required data, FDO data providers are used to connect the GIS-based parcel and street centerline data to the CAD-based site design. Next, a geospatial buffer is created at a distance of a half-mile from the site boundary. The buffer is used to determine proximity and involves generating a polygon at a specified distance from the proposed site boundary. Finally, in this simplified example, a geographic query is used to determine the number of intersections within the buffer and this number is compared to the LEED criteria.
Some of the benefits of this approach include the following:
- Data conversion and data redundancy can be avoided as a result of using FDO data providers to connect to the data directly rather than relying on an import/export process.
- Efficiency is improved as a result of applying an approach that embraces CAD tools for site design and geospatial tools for analysis all in one software platform.
- Better designs are possible because more design alternatives can be evaluated against LEED criteria.
Friday, July 10, 2009
Cowboys, Barbeque and Geospatial Analysis
 Yee Haw! It’s Stampede Week in Calgary, Alberta and what better way to celebrate than to combine Stampede attire (ie cowboy hat, jeans, big belt buckle and boots) with a seminar on Geospatial Analysis. Well, it seemed like a crazy idea; however, the folks at Autodraft, Inc have a great sense of fun. So, when I was given the opportunity to talk about my favorite topic of Engineering GIS and CAD/GIS integration, I jumped at the chance.
In spite of the Stampede traffic, the rain and the tornado watches, folks came out in droves to learn how to analyze their CAD drawings and geospatial data using the powerful geospatial analysis tools found in Engineering GIS. With the help of my pardner "Cowboy Bob", we delivered a seminar entitled "Geospatial Analysis for the Egnineering and CAD Professional". We used AutoCAD Map 3D, AutoCAD Raster Design and Autodesk Topobase to demonstrate numerous geospatial techniques including…

- Queries and how to use them to get more information from CAD drawings and GIS data sources
- Drawing cleanup tools and why they are necessary to ensure the accuracy and correctness of CAD and GIS data
- Topology, it’s importance for CAD and GIS users alike and how to create topologically correct features
- Spatial analysis such as network traces and their use with CAD and GIS data
- Polygon overlay and its power to reveal new patterns in CAD and GIS data
- Buffer analysis and why it’s sometime the best way to determine spatial proximity
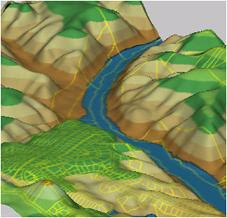
- 3D surfaces and how to analyze them for height, slope and aspect
- Raster to vector conversion and how to combine scanned CAD drawings, maps and aerial imagery with vector-based CAD and GIS data
- And more…
A fun and informative Yee Haw time was had by all!


